Which Hotel REITs Generate the Highest EBITDA Margins and Pass Along the Most Money to Investors?
By Hans Detlefsen and Matthew Glodz
Hotel Appraisers & Advisors (HA&A) is pleased to announce our second annual ranking of hotel real estate investment trusts (REITs). HA&A currently monitors 16 hotel REITs, discussed throughout this report. Some hotel REITs are more effective than others at generating earnings and passing profits on to investors. In this year’s report, we rank each of these hotel REITs according to three metrics: (1) dividend yields; (2) EBITDA margins; and (3) overhead expenses. Our 2017 rankings are based on year-end 2016 data from each of the 16 hotel REIT companies we monitor.
Hotel REITs offer some of the highest dividend yields in the stock market. Their current dividend payments represent yields in the range of 4.3 percent to 7.5 percent. By comparison, the average dividend yield of all stocks in the Dow Jones Industrial Average is currently 2.7 percent. Figure 1 ranks each hotel REIT we track by its dividend yield[1].
Figure 1 – Ranking Hotel REITs by Dividend Yield 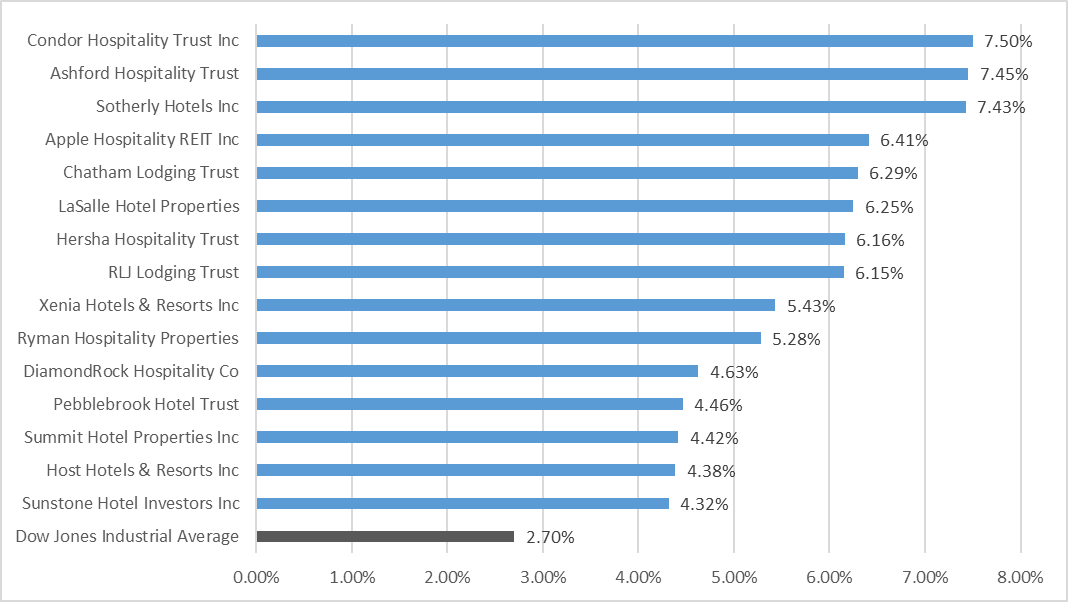
The three smallest hotel REITs, by market capitalization, offer the highest dividend yields. For example, Condor Hospitality (CDOR) has a market capitalization of only about $122 million while offering the highest dividend yield in our study of approximately 7.5 percent. High dividends represent one way for smaller hotel REITs to attract investors. Everything else being equal, one would expect REITs with lower dividend yields to produce higher capital gains. But everything else is not always equal[2], which leads to our next topic.
The second metric we track is a way to measure profitability. Specifically, we analyzed the overall profit margins of each REIT’s hotel portfolio. We calculated this metric by isolating each REIT’s hotel-generated earnings before interest, taxes, depreciation, and amortization (EBITDA), a common earnings metric in the industry. We then expressed these earnings as a percentage of hotel operating revenues derived from the hotels owned by each REIT. We applied a standardized reserve for replacement expense to each REIT’s portfolio, equivalent to 4.0 percent of annual hotel operating revenues, when calculating the hotel EBITDA amounts. The resulting profit margin ratio is a simple metric that allows us to measure how profitable the hotels are within each REIT’s portfolio. This metric helps investors understand how efficient each REIT’s hotels are at converting revenues into profits.
Figure 2 illustrates that hotel REITs exhibit a wide range of profitability from their respective hotel portfolios. The figure shows hotel EBITDA ratios that range from 22.2 percent to 37.2 percent of total hotel operating revenues.
Figure 2 – Ranking Hotel REITs by Profit Margins 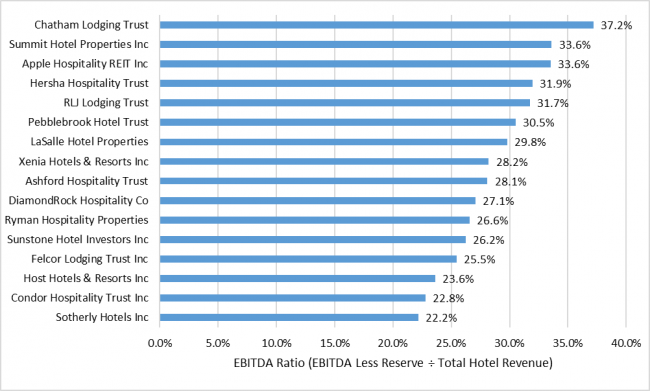
In general, limited-service and select-service hotels operate more efficiently than full-service hotels and resorts. Newer hotels and hotels in higher-rated markets also tend to produce higher profit margins than older hotels or hotels in lower-rated markets. So, it is not surprising that the four REITs that scored highest on this metric for 2016 have portfolios primarily containing limited-service and select-service hotels, mainly located in highly-rated destinations or urban markets.
Year-over-year, eleven of the REITs we monitor experienced profit margin increases, while five REITs experienced profit margin declines. Summit Hotel Properties, Inc. (INN) experienced the biggest gain, jumping to second place in our ranking for this metric. Pebblebrook Hotel Trust (PEB) was another company that experienced a significant year-over-year improvement in its portfolio’s aggregate profit margin.
The third metric we track is intended to measure how efficiently each REIT passes along hotel profits to its investors. It is a measure of how expensive it is for each REIT to manage and administer its hotel portfolio. Investors in hotel REITs have at least two types of fees that must be paid to managers and administrators.
The first type of fees we monitor are hotel management fees. REITs hire professional hotel management companies[3] to oversee the day-to-day operations of each hotel they own. In addition to paying for labor and other operating expenses at the hotels, the REITs must pay a professional fee to each of these companies they retain to manage property-level hiring, training, reporting, and other management duties. These expenses are called hotel management fees.
The second type of fees we monitor are corporate expenses. Each REIT’s internal staff has responsibilities for implementing an investment strategy, asset management, and other corporate tasks, all of which represent expenses to the investors. These expenses are typically called corporate general and administrative expenses, or something similar.
Together, the sum of the hotel management fees and the REITs’ corporate general and administrative expenses represent a rough gauge of how much it costs investors to extract profits from each REIT’s portfolio of operating hotels.
For comparison purposes, we sum each REIT’s 2016 base management fees, incentive management fees, and corporate overhead expenses, including corporate general and administrative expenses as well as advisory service fees.[4] We then compare these expenses to each REIT’s 2016 hotel earnings (before management fees are deducted).
Figure 3 illustrates a wide range of performance among the REITs on this metric. For every dollar of earnings generated by the hotels in a REIT’s portfolio, somewhere between 13.7 cents and 56.9 cents were spent on hotel management and corporate overhead in 2016. In this figure, a lower ranking is better.
Figure 3 – Ranking Hotel REITs by Overhead Expense Ratios 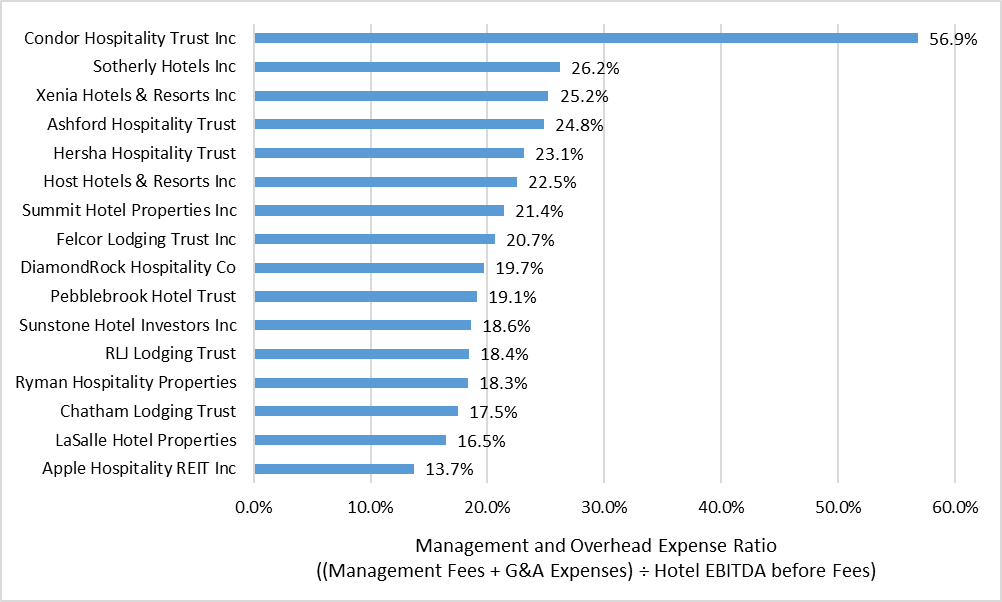
Apple Hospitality REIT Inc. (APLE) offers the leanest overhead and management structure. With more than 30,000 hotel guestrooms in its portfolio, APLE’s size is a contributing factor to its cost effectiveness. In 2016, for example, APLE spent only $566 per guestroom on corporate general and administrative expenses, compared to an average of $2,073 for the 16 hotel REIT companies we monitor. LaSalle Hotel Properties (LHO), Chatham Lodging Trust (CLDT), Ryman Hospitality Properties (RHP), RLJ Lodging Trust (RLJ), Sunstone Hotel Investors Inc. (SHO), Pebblebrook Hotel Trust (PEB), and DiamondRock Hospitality Company (DRH) all exhibited overhead expense ratios below 20.0 percent of their earnings in 2016.
Condor Hospitality Trust Inc. (CDOR) had the highest corporate and management expenses in 2016. This is partly because CDOR was in the initial phase of a major transition in 2016, shifting its asset allocation away from economy hotels and towards upper-midscale and upscale, select-service hotels. As this transformation continues, the company’s expense ratio may decline significantly.
Year-over-year, ten of the REITs we track improved their expense ratios, while six REITs became more expensive to oversee. Sotherly Hotels Inc. (SOHO) particularly stood out by achieving a significant decline in corporate expenses in 2016.
The figures discussed throughout this article can vary from year to year. However, all else equal, investors may generally prefer to gain exposure to hotel portfolios with higher operating profit margins and lower management and corporate overhead expenses. Some investors may also be attracted to certain hotel REIT stocks due to the relatively high dividend yields they pay. This report is intended for discussion purposes only and is not intended to be construed as investment advice.
[1] Calculated based on most recent annualized dividend amounts and closing stock prices, as of September 14, 2017. [2] See Figure 2. [3] While REITs are not allowed to manage their own hotel properties, some of the REITs we track have officers who own shares in the third-party management companies the REITs employ to manage their hotels. [4] For the purpose of this article, we collectively refer to these expenses as “overhead” expenses.